
Introduction:
Podcasts have become an essential medium for creators to engage with their audiences. However, even seasoned creators on platforms like Spotify struggle to understand which content resonates most with their listeners. This article will guide you through our journey of analysing podcast performance and how we built a custom solution to gain deeper insights.
At Media CTO, we launched two seasons of podcasts featuring tech-savvy event professionals. As an AI and data-driven company, we sought to understand our podcast performance better. That's when we found out about Spotify for Creators - Analytics Dashboard.
Despite Spotify's helpful metrics for Creators, we found limitations in the analytics dashboard that prevented us from fully understanding our content's performance, especially when filtering by date range and comparing the performance of individual episodes.
However, we found a workaround that has helped us overcome these challenges. This article will share our solution and how you can replicate it. The code snippet will be provided at the end of this blog post.
Bonus: Watch how this solution works on youtube - 100% free to get a quick understanding on the Spotify Automation Workflow, and how you can start automating for your own podcast / music channels.
Spotify Analytics Dashboard for Creators
What is Spotify for Creators?
Spotify for Creators provides “powerful tools to connect directly with fans, understand how your podcast gets discovered, and stand out on the world’s most popular listening platform,” based on Spotify's official blog post: https://creators.spotify.com/resources/how-to/start-a-podcast
Essentially, that means the Spotify for Creator platform has a Spotify Analytics Dashboard with insights into listeners' listening activities. This dashboard is built for Spotify Creators and Podcasters looking to analyse and improve content performance easily.
Metrics: Spotify provides metrics like Impressions, Plays, Consumption Hours, Streams, and Followers to help creators gauge audience engagement.
Cross-platform Performance: If your podcast is available on other platforms like Apple Podcasts, the Spotify Dashboard not only shows your Spotify listening stats but also has a section that shows a combined view of Streams and Downloads.
How to access the Spotify for Creators Dashboard?
You can access the Spotify for Creators Dashboard by following these steps:
Analytics Available in Spotify for Creators
Harnessing Spotify’s built-in analytics empowers podcasters and creators to understand how and by whom their content is being consumed. Spotify for Creators offers four complementary dashboards. Each is designed to highlight a different facet of performance, discovery, audience composition, and content ranking. Below is what you’ll find in each.
Overview Performance
The Overview dashboard gives you a high-level pulse on your show’s health. Here you’ll see total plays, cumulative consumption hours, and net follower growth over your chosen date range, presented as scorecards and a day-by-day trend line chart.

This quick snapshot helps you spot spikes (for example, after a new episode drops or a promotional push) and lulls, so you can correlate performance with your release schedule and marketing activities.
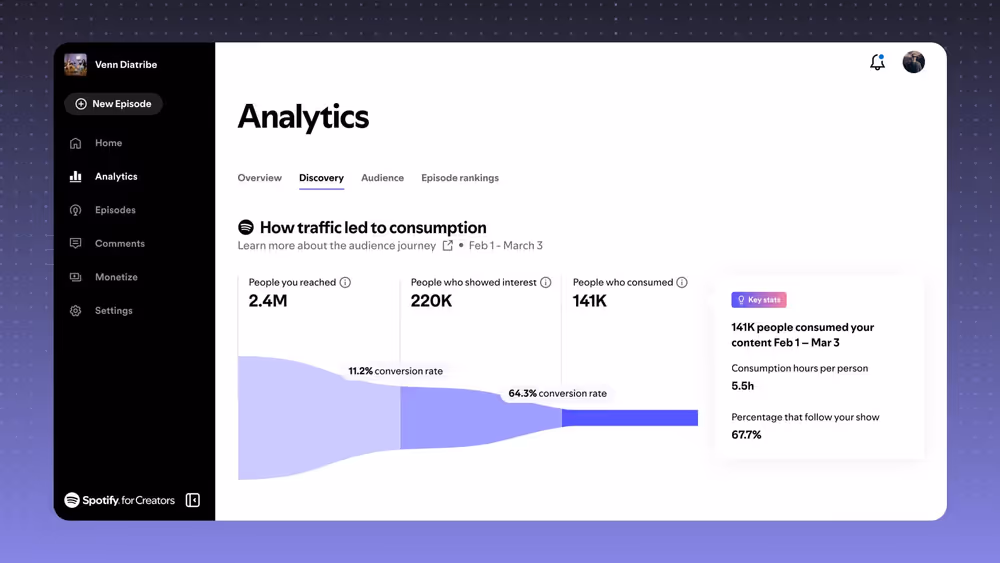
Discovery Dashboard
The Discovery view breaks down how listeners are finding your show. Whether they stumble upon you via Spotify search, tap in from personalised recommendations, browse your show’s page directly, or click through from external embeds, this dashboard quantifies each source.
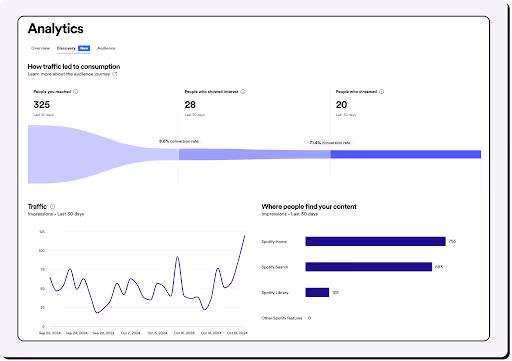
By comparing first-time listener metrics across channels such as “Home,” “Your Library,” “Search,” and “Embed,” you can optimise your keywords, playlist pitching, and embed placements to drive more discovery.
Audience Insights
Dive deeper into who is tuning in with the Audience dashboard. Spotify surfaces demographic slices like gender and age brackets alongside geographic distribution by country.
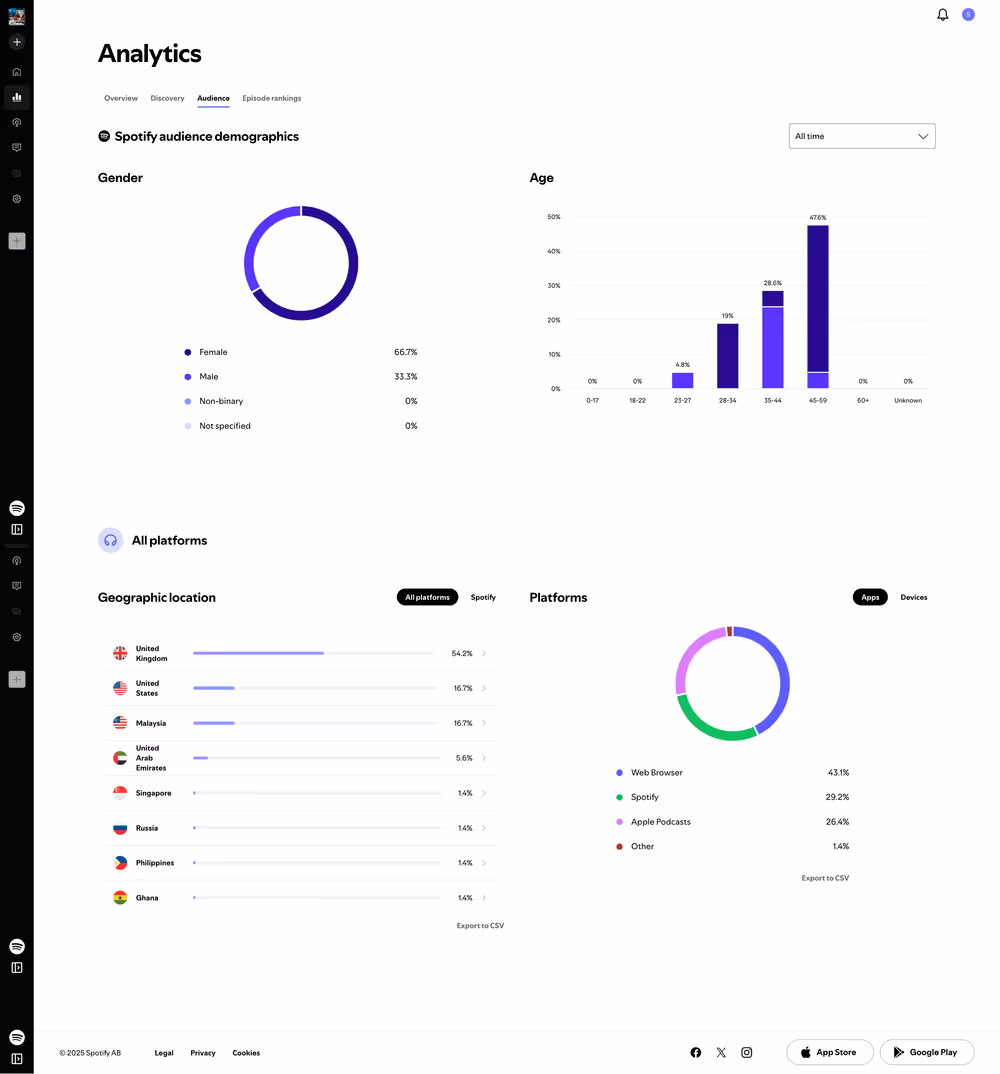
If you switch the view, you also get a breakdown of listening platforms (web browser, mobile app, Apple Podcasts, etc.) and device types.
These insights let you tailor your topics, episode length, and promotion tactics to the segments that care most about your content.
Episodes Ranking
The Episode Ranking dashboard highlights your show’s single best-performing episode based on total streams and downloads.

While it’s helpful to know which episode has resonated most with your audience, the lack of date-range filters or segmenting options means you can’t compare performance over different periods or isolate recent trends.
As a result, its practical value is limited to identifying your all-time flagship episode rather than informing more granular content decisions.
Podcasts Metrics
This Spotify Analytics Dashboard contains the key metrics collected for the Spotify platform, such as Impressions, Plays, Consumption Hours, Consumption Hours per person, Streams, and Followers.
If you’re hosting your content on other platforms like Apple Podcasts, you'll be able to see the overall performance of all the platforms in terms of Streams and Downloads (Plays).
For accurate definitions of the engagement metrics (how they are calculated in Spotify), kindly refer to Spotify documentation.
Limitations of Spotify Analytics Dashboard
While Spotify for Creators provides valuable insights, several key limitations make it difficult to assess podcast performance fully. These include challenges with filtering data by date range, comparing episode performance, and isolating recent episode data. Let’s explore how these limitations impact your ability to track and optimise content.
The Spotify Overview Dashboard allows filtering by dates, but this only applies to overall performance, including all historical content. You can view metrics like Impressions, Plays, and Followers over a selected time range, but you cannot filter by date for specific episode performance.
This makes it difficult to:
In addition, the Episode Rankings Dashboard doesn’t allow filtering by dates. It shows aggregated data for the best-performing episodes, making it challenging to evaluate recently uploaded episodes.
This makes it difficult to isolate and accurately assess the performance of individual episodes, especially since content can be evergreen and users may still discover older episodes through Spotify’s search.
That means you're stuck if you're trying to analyse individual content performance by date range (especially when you launch a campaign), compare how a single episode performed week over week, or track growth over time.
When analysing podcast performance, understanding the stream vs. start ratio is essential to gauge how your audience engages with your content.
Here’s a breakdown of the terms and why they matter:
Start: This refers to the number of times a podcast episode is initiated or begun. Essentially, it’s the moment a listener clicks "play" on your episode.
Stream: This is the total number of times the episode is played fully or partially. A stream is counted each time the episode is played, but it may not mean the episode was listened to in its entirety.
Stream per Start Ratio: The stream per start ratio measures how often listeners continue playing the episode after they first start it.
A high stream per start ratio indicates that your content is compelling and listeners are sticking around to finish it. If people are dropping off quickly, it might suggest that your episode isn’t engaging enough or didn’t meet listeners’ expectations. This provides a great feedback loop for creators to refine and improve content.
Lacking these metrics for individual content pieces makes it hard to analyse and improve.
Without access to these metrics for individual episodes, it becomes challenging to assess how specific content is performing and make data-driven improvements to enhance listener engagement.
The Overview Dashboard only provides aggregated data, meaning performance metrics are not specific to individual episodes. As a result, podcasters cannot evaluate the performance of recently uploaded episodes or isolate the data for specific content.
This lack of episode-specific data makes it difficult to accurately assess recent content’s impact, especially when you want to evaluate the effectiveness of new episodes in the context of campaigns or track how they compare to older, evergreen content. This can hinder decision-making when planning future episodes and marketing efforts.
Our Setup and What You’ll Need
To overcome the limitations of Spotify for Creators and gain deeper insights into podcast performance, we developed a custom analytics setup using various tools. In this section, we’ll walk you through the components of our solution and the tools you’ll need to replicate it for your own podcast reporting.
Here's what you'll require:
With this setup, you can automate your podcast performance data's collection, analysis, and visualisation, enabling better decision-making for future content.
Spotify Podcast Analytics: Our End-to-End Data Workflow
We wanted more control and flexibility in analysing podcast performance than Spotify for Creators offers in its default dashboard.
So, we built a fully automated workflow using Python, Google Sheets, BigQuery and Looker Studio to streamline the entire process, from data collection to reporting.
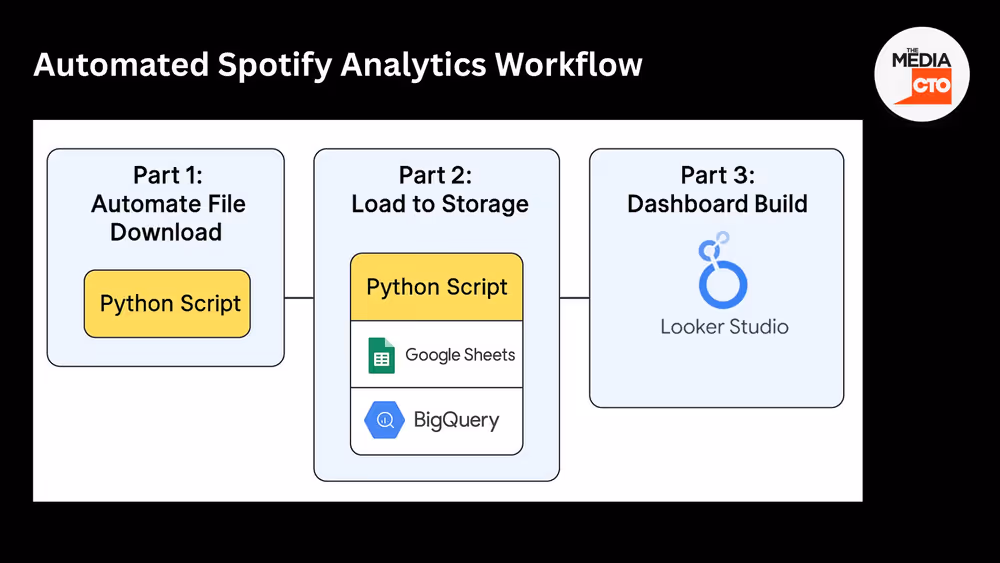
As part of the script, we log into Spotify, navigate through each episode’s analytics page, and download two important datasets:
Once downloaded, the data is cleaned and combined, then exported to Google Sheets, optionally paired with email notifications, and written into BigQuery, which powers our custom reporting dashboard in Looker Studio.
Gentle Reminder: Watch how this solution works on youtube - 100% free to get a quick understanding on the Spotify Automation Workflow, and how you can start automating for your own podcast / music channels.
Note: We’ll share the full Python script at the end of this article.
Part 1: Automate File Download from Spotify for Creators
Since Spotify doesn’t offer a public API for episode-level analytics, we built a Python-based script to automate the entire process—from logging in to Spotify, navigating each episode, downloading performance CSVs, and combining them into a single, clean dataset. This script handles both the Spotify-only metrics and the all-platform metrics, giving us the full picture across engagement and distribution.
You don’t need to start from scratch—we’re sharing the exact script we use, which you can download and adapt for your own podcast setup (see the link at the end of this article).
Below is a quick breakdown of the steps involved:
Step 1: Install & Import Packages
Install the required Python packages, including selenium, pandas, dotenv, and others. Once installed, import them into your environment. We use VSCode to run the script locally, but any Python-compatible IDE will work.
Python packages used in the script:
Step 2: Login to Spotify
We use Selenium WebDriver to automate the Spotify login process. The Chrome driver is configured with custom options, such as setting the download directory and adjusting browser behaviour (e.g., disabling sandbox, enabling headless mode if needed).
2.1: Prepare Your .env File
We store Spotify login credentials in a .env file to avoid hardcoding them in the script. The python-dotenv package loads this file.
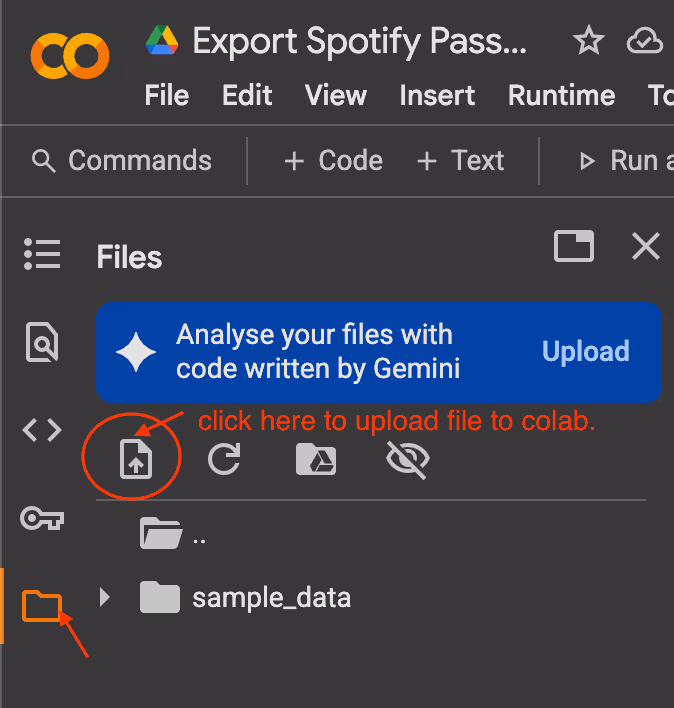
To prepare your credentials file in the correct format, you can use the following snippet in Google Colab:
https://colab.research.google.com/drive/1SWZs4OJYaRlcIRCxO01sBMShk4Cwj2Pp
Your .env file will look like this:
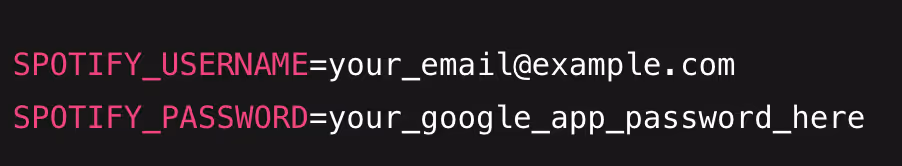
💡 Use a Google App Password instead of your main Google password — it’s more secure and works better for automation.
Once downloaded, place this file in the same directory as your Jupyter Notebook or Python script. The script will automatically load your credentials from this file. If you’re using Colab, you must upload this file to your workspace every time you run the script.
The script opens the Spotify for Creators login page, clicks “Continue with Spotify”, enters the email, and completes the login using the Google App Password. Occasionally, Spotify may trigger additional verification (e.g., phone confirmation), which must be done manually. This is one of the known limitations of using this scraping-based method.
Additional Note:
If you're running the script in Google Colab, Chrome WebDriver must be configured to support downloads in headless mode. This includes setting the download directory (/content) and enabling download behaviour using Chrome DevTools Protocol.
The script already handles this configuration for you, so you don’t need to modify anything. However, it's important to note that this setup is only required in Colab. If you're running the script locally (e.g., in VSCode), the Chrome DevTools Protocol configuration is not necessary.
Step 3: Navigate to Podcast Episode Page
After logging in, the script uses Selenium to navigate through the Spotify for Creators dashboard. Since the interface is built using Shadow DOM, we execute JavaScript within Selenium to access and traverse these encapsulated elements.
The script then locates the specific podcast show (e.g., “Digitising Events – UNSCRIPTED”) and clicks on its page. This step is essential because a single creator account may manage multiple shows, and we want to target the correct one before proceeding to episode-level data.
Step 4: Scrape Episodes List Table
On the podcast page, the script scrapes the episode list table and extracts key metadata such as the title and publication status. We also found that each episode row includes a clickable link with an href attribute that contains the unique episode ID.
Instead of relying on button clicks, we extract this ID directly and use it to construct the analytics URL for each episode using the following pattern:
https://creators.spotify.com/pod/dashboard/episode/
This method reliably allows us to navigate directly to the analytics page for each episode in the next step.
Step 5: Handle File Downloads
Before downloading new data, the script checks the download directory to see if files with similar names exist. This prevents issues with automatic filename duplication (e.g., file.csv, file(1).csv, file(2).csv) that can occur during repeated runs. By identifying and removing or overwriting old files, we ensure that only the latest version of each downloaded CSV is processed, keeping the dataset clean and consistent.Sometimes, the script doesn’t work, so I always manually clean up the files after receiving a notification email.
Step 6: Download CSV for Each Episode
The script constructs direct URLs to navigate to each episode’s analytics page using the episode IDs collected earlier. This avoids the need to manually click through the dashboard and significantly speeds up the process.
Once on the analytics page, the script resizes the browser window to a smaller width. This is an important trick—it ensures the time range dropdown menu is visible and clickable, which can otherwise be hidden on wider layouts.
After resizing, the script selects the "All Time" option from the dropdown to ensure the data includes the episode's full performance history.
From there, the script downloads two CSV files:
After successfully downloading both files, their file names are stored back into the main episode DataFrame. This mapping ensures each episode is linked to its corresponding downloaded data, essential for clean and accurate merging in the next step.
Step 7: Combine Downloaded Data
Once all CSV files have been downloaded, the script scans the download directory and loads each file into a Pandas DataFrame.
Next, the script performs basic cleaning, such as trimming whitespace, standardising column names, and formatting date fields. This step helps align the data from different files to be combined reliably.
Finally, the cleaned DataFrames are merged into a single unified dataset, ready for export to Google Sheets or BigQuery in the next step.
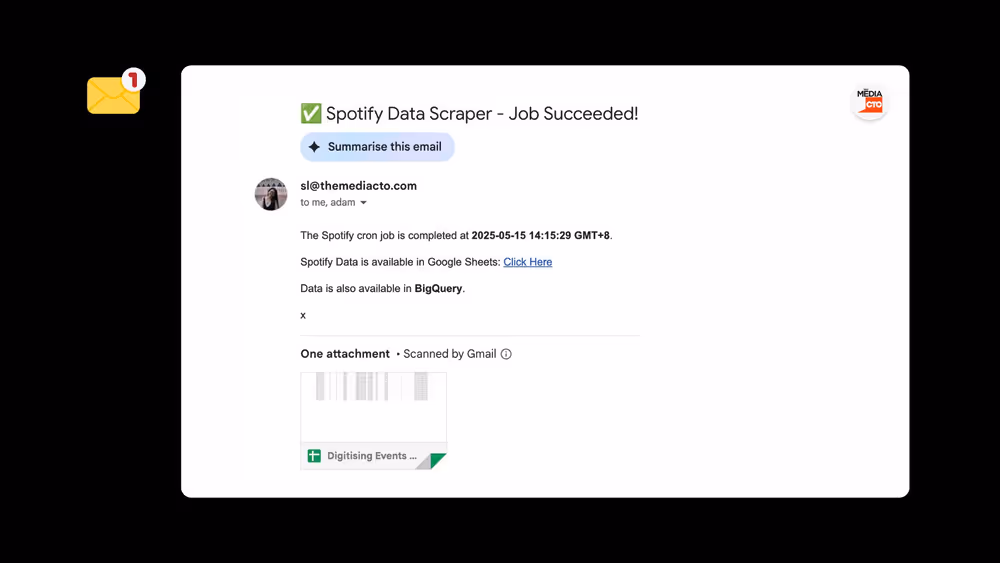
Step 8: Email Notification (Optional)
At the end of the script, an email notification is sent to the designated PIC (person in charge) to confirm that the script has run. This is especially helpful when the script is scheduled to run automatically in the background, such as via a task scheduler or cron job.
The email includes a short message and a log summary, making it easy to verify that the workflow was completed without needing to check the terminal or output files manually.
However, it's important to note that if the script is not triggered at all (e.g., due to scheduler issues), no email will be sent. Similarly, if the script crashes before reaching the notification step, no email is dispatched. These are current limitations of the notification implementation, and they may be addressed in a future improvement.
Part 2: Load to File Storage / Data Warehouse
Once the data is cleaned and combined, the next step is making it accessible for reporting. We use Google Sheets and BigQuery, taking a lightweight and flexible approach.
We first write the transformed dataset to Google Sheets, which acts as a quick and accessible checkpoint. This is useful for manual reviews, fast edits, or sharing a simplified view with non-technical collaborators.
From there, we connect the Google Sheet directly to BigQuery. This setup allows BigQuery to pull the most recent data without requiring file uploads or manual syncing. Since the dataset is relatively small, this method works well without affecting performance, and it saves us from managing an additional storage or ETL layer.
Also, since we already use BigQuery as our central data warehouse, this setup is a no-brainer. It allows us to integrate podcast data seamlessly with other datasets, like transactional records, GA4 data, or campaign logs, unlocking deeper insights beyond podcast metrics alone.
In the end, this approach gives us flexibility, scalability, and a foundation for building richer, multi-source analysis without overcomplicating the pipeline.
Now, let’s dive into how we can set this up.
Step 1: Create Google Sheets
First, we need to prepare the necessary credentials and permissions to enable programmatic access and allow our script to write cleaned podcast analytics data into Google Sheets (and later into BigQuery).
Once created, copy the Sheet ID from the URL:
https://docs.google.com/spreadsheets/d/FILE_ID_HERE/edit#gid=0
You’ll use this ID in your script to connect and write to the correct spreadsheet.
Step 2: Create a Service Account
Next, you’ll need to authenticate the script using a Google Cloud service account. This allows your script to connect securely to Google Sheets and BigQuery.
Refer the Official Guide to create a service account: https://developers.google.com/workspace/guides/create-credentials#service-account
Step 3: Grant access to the Google Sheet
Finally, share the Google Sheet you created in Step 1 with the service account email (you’ll find this inside the JSON file, e.g. your-service-account@your-project.iam.gserviceaccount.com).
Make sure you grant Editor access so the script can update the sheet.
This setup ensures your script has secure, automated access to the spreadsheet and can push cleaned data to it on each run. From there, we’ll connect the Google Sheet directly to BigQuery to complete the data pipeline.
Step 4: Connect Google Sheets to BigQuery
Before data flows into your Google Sheet, you can prepare your BigQuery environment by linking the sheet as an external table. This ensures BigQuery will immediately reflect any new data once the script writes it.
The steps are as follows:
Part 3: Build a Custom Spotify Podcast Dashboard
Once the data is cleaned and loaded into BigQuery, we bring it to life in a custom Looker Studio dashboard. Looker Studio is a free data visualisation and reporting tool by Google.
This dashboard pulls together overall and episode-level metrics, engagement trends, and traffic insights into one place. This custom Podcast Dashboard works pretty well specifically for creators who want more clarity and control over their podcast performance. While it's tailored to our internal needs, other creators and teams can take inspiration from it or adapt it to suit their own setup.

Here’s what this dashboard made possible:
This setup gives us a clear lens into what’s working, what needs improvement, and how our content performs beyond surface-level stats. It’s a powerful tool that any team can replicate with the right data foundation and reporting workflow.
Limitations
This workflow fills the current gap in Spotify’s reporting, but it has limitations.
First, Spotify doesn't offer a public API to access episode-level analytics, which means the data must be exported manually or scraped using tools like Python and Selenium. This method works, but it requires a technical setup. While exploring using Google Colab to reduce local dependencies, we haven’t yet had consistent success.
Second, there are occasional interruptions, such as Spotify asking for phone verification, which must be completed manually. Sometimes, a change in UI / code structure in Spotify for Creators website, may make the code invalid. (We are trying our best to keep our code most up-to-date).
On the GA4 side, meaningful tracking is only possible if UTM tagging is implemented correctly from the beginning. Finally, once files are downloaded and uploaded to storage (e.g., Google Sheets or BigQuery), they must be removed from the download directory—otherwise, future runs may result in duplicated files or filenames like file(1).csv.
Despite these hurdles, this workflow remains a solid transitional solution until Spotify provides more robust analytics access or an official API for creators to work with.

